Using a Jenkins Pipeline to Add Grafana Annotations for Release Monitoring
-
Engineering
- 29 Mar 2018
For the Plivo tech team, DevOps is not just a more efficient way of building products, it’s a way of life. To make things more efficient, we’re always trying out new things to see what works and what doesn’t. Release process is one area where we see a lot of scope for innovation. Today we’re sharing one best practice that’s working well for us.
At Plivo, we use Jenkins as our CI/CD tool. Specifically, we use Jenkins Pipeline DSL to write build jobs as code. Using CI/CD, we deploy code several times a day across many microservices. To ensure that our services are performing optimally within the defined system parameters, we monitor a variety of metrics across releases immediately after the deployment, and annotate Grafana panels via Jenkins Pipeline.
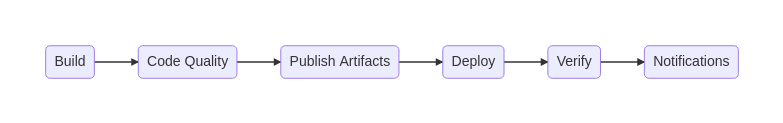
Our CI/CD pipeline has multiple stages:
During the Deploy stage, we annotate Grafana panels via their annotate REST API using the POST /api/annotations API.
The pipeline code looks like this.
echo "Creating annotation in Grafana with tags: ${tags} and description: ${text} ..."

withCredentials([[$class: 'StringBinding', credentialsId: 'GRAFANA_APIKEY', variable: 'GRAFANA_APIKEY']]) {
	apiKey = env.GRAFANA_APIKEY
	httpRequest(
		acceptType: 'APPLICATION_JSON',
		consoleLogResponseBody: false,
		contentType: 'APPLICATION_JSON',
		customHeaders: [[maskValue: true, name: 'Authorization', value: 'Bearer ' + apiKey]],
		httpMode: 'POST',
		requestBody: toJson(payload),
		responseHandle: 'NONE',
		url: grafana + '/api/annotations',
		validResponseCodes: '200'
	)
}
We use the Grafana API credentials (GRAFANA_APIKEY) from the Jenkins credentials store. The payload to the /api/annotations API is sent as a JSON object, as shown in this Grafana docs example.
{
  "time":1507037197339,
  "isRegion":true,
  "timeEnd":1507180805056,
  "tags":["tag1","tag2"],
  "text":"Annotation Description"
}
Once the annotations are sent to Grafana, we add them to the Grafana panels manually. We will use the optional dashboardId and panelId fields in the future to build dashboards on the fly with Grafana 5.0, removing the need to manually add annotations.
The code above produces Grafana annotation like this.

This Grafana panel for an imaginary service has an annotation between 12:16 and 12:22, which is the duration of the deployment, and it contains a description and tags. The description includes the version and the person responsible for the deployment as well as the approver for the release. The description and the tags are defined using variables earlier in our pipeline code.